Signals/Market Breadth
Market breadth: is the rally real?
Breadth shows what share of an index trades above its moving average, and how that has changed day by day. When an index rises but fewer of its stocks are above their averages, the headline move is hiding what's underneath.
14 days free, then $20 a month. Research tools, not investment advice.
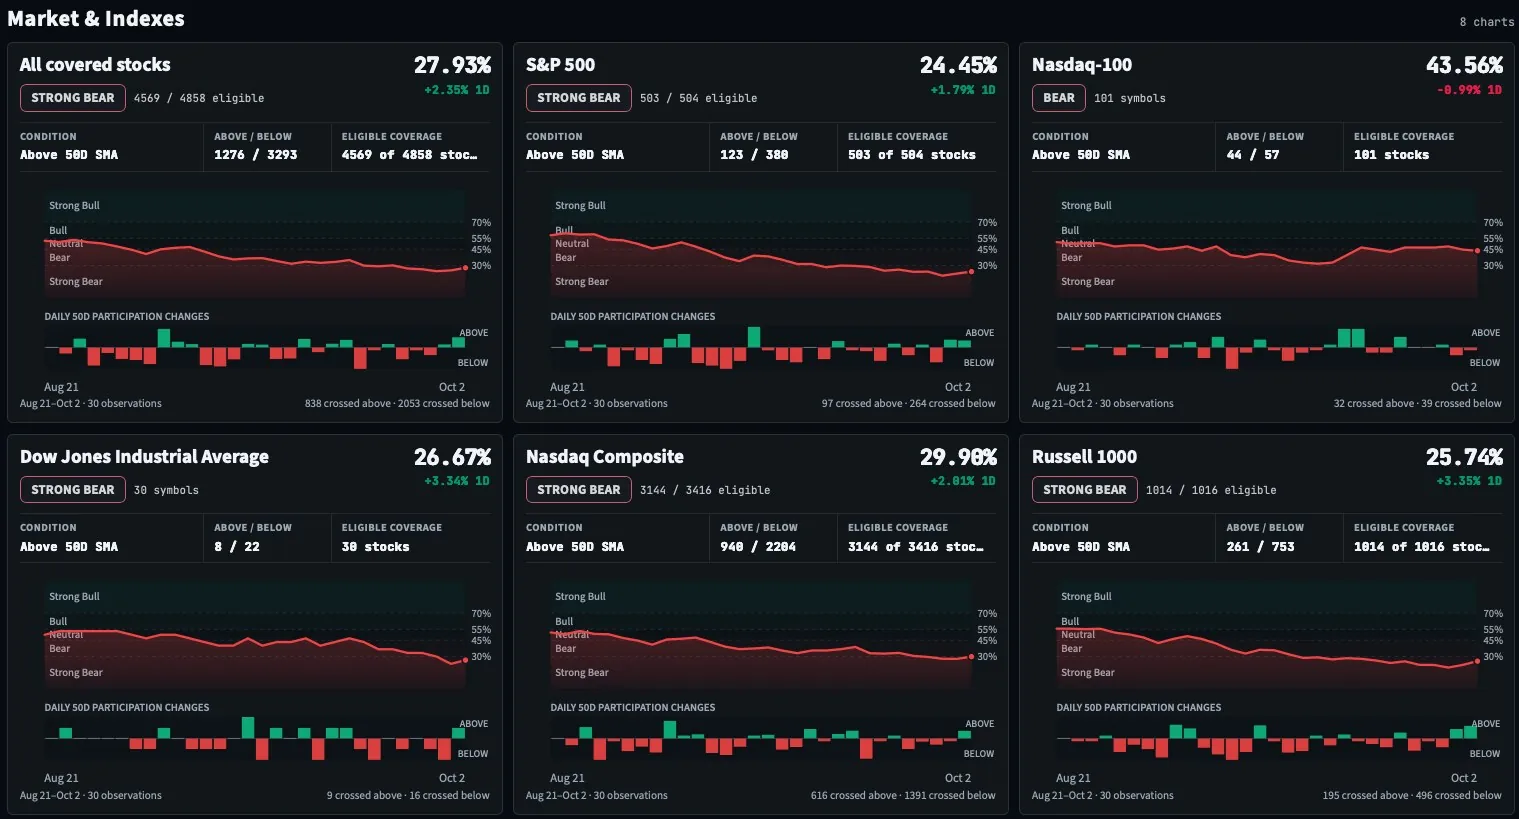
One reading per index,
with the history behind it.
% above the average
The share of an index's stocks closing above their 20, 50 or 200-day SMA, with how many are above and below.
A labelled history
Each chart is shaded from Strong Bear to Strong Bull, so you can see whether participation is improving or fading.
Daily participation
Bars show how many stocks crossed above or below the average each day.
Five bands, from Strong Bear to Strong Bull.
Signals labels each breadth reading by the share of stocks above the average.
| Share above the average | Label |
|---|---|
| 70% or more | STRONG BULL |
| 55% to 70% | BULL |
| 45% to 55% | NEUTRAL |
| 30% to 45% | BEAR |
| Below 30% | STRONG BEAR |
The indexes you follow.
Breadth for the whole market and for each major index, plus every sector. Signal Context also puts market and sector breadth beside every Watchlist stock.
- All covered stocks
- S&P 500
- Nasdaq-100
- Dow Jones Industrial Average
- Nasdaq Composite
- Russell 1000
- and more
- 20-day SMA
- 50-day SMA
- 200-day SMA
Market breadth FAQ
What is market breadth?
Market breadth measures how many stocks are taking part in a move. Signals reports it as the share of an index's stocks closing above a moving average.
Why does breadth matter if the index is up?
Large companies can carry an index while most of its stocks fall. Breadth shows whether the move is broad or narrow.
Which average should I use?
The 20-day SMA reacts fastest, the 50-day shows the intermediate picture and the 200-day the long-term one. Signals shows all three.
When does breadth update?
After each completed trading day, using closing prices.
See how broad the move really is.
Breadth for every index and sector is included in the free trial.