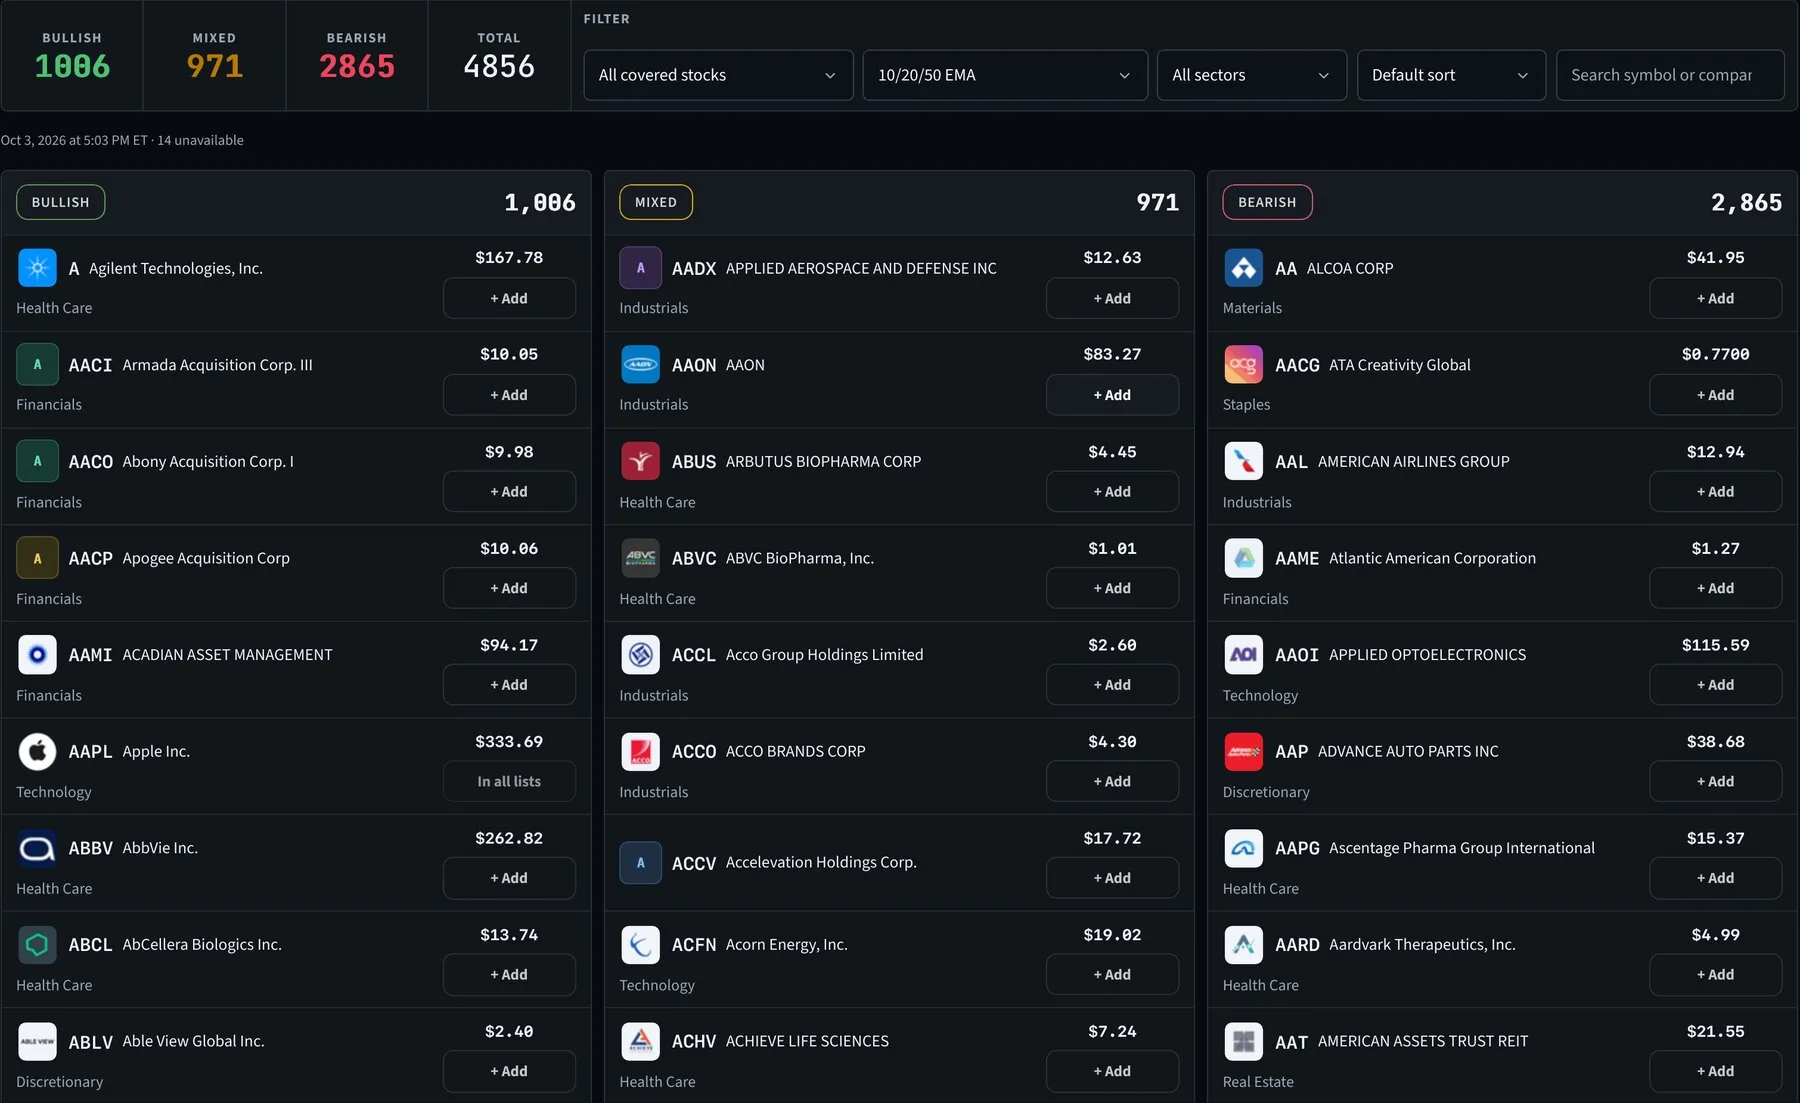
Every stock, sorted by direction.
Thousands of U.S. stocks split into Bullish, Mixed and Bearish columns. Choose all covered stocks or an index, switch between preset models, filter by sector and add anything to a watchlist in one click.
- Counts update with each publication
- Filter by sector or search by name
- One-click add to any watchlist
Is the rally real?
Breadth shows what share of an index sits above its moving average — and how that has changed — so a headline index move never hides what's underneath.
- Above the 20, 50 or 200-day SMA
- S&P 500, Nasdaq-100, Russell and more
- Daily participation changes
More about Market Breadth →
Which sectors are carrying the market.
Start from all 11 sectors, then open one. Here Technology reads Bullish: 58.9% of its stocks rose over the month, the typical stock gained 3.6%, and its 13 industries are ranked strongest to weakest.
- Sector direction and the share of stocks rising
- Industries ranked by return
- How returns spread across every stock in the sector
Who moved, and how far.
The biggest gainers and decliners by dollars and by percent, then every mover in one sortable list you can narrow to an index.
- Top gainers and decliners by $ and %
- Filter by S&P 500, Nasdaq-100, Russell and more
- Volume beside average volume
Narrow thousands to a shortlist.
Start with a ready-made screen in one click, like Bullish breakouts, Pullback in an uptrend or Unusual volume. Or build your own from more than 30 filters covering price, volume, trend, 52-week highs and lows, relative strength, valuation, earnings timing and sector strength, then save it.
- Ready-made screens for breakouts, pullbacks, earnings and unusual volume
- More than 30 filters to combine and save
- Add results to a Watchlist
More about the Stock Screener →
Charts that show the stack.
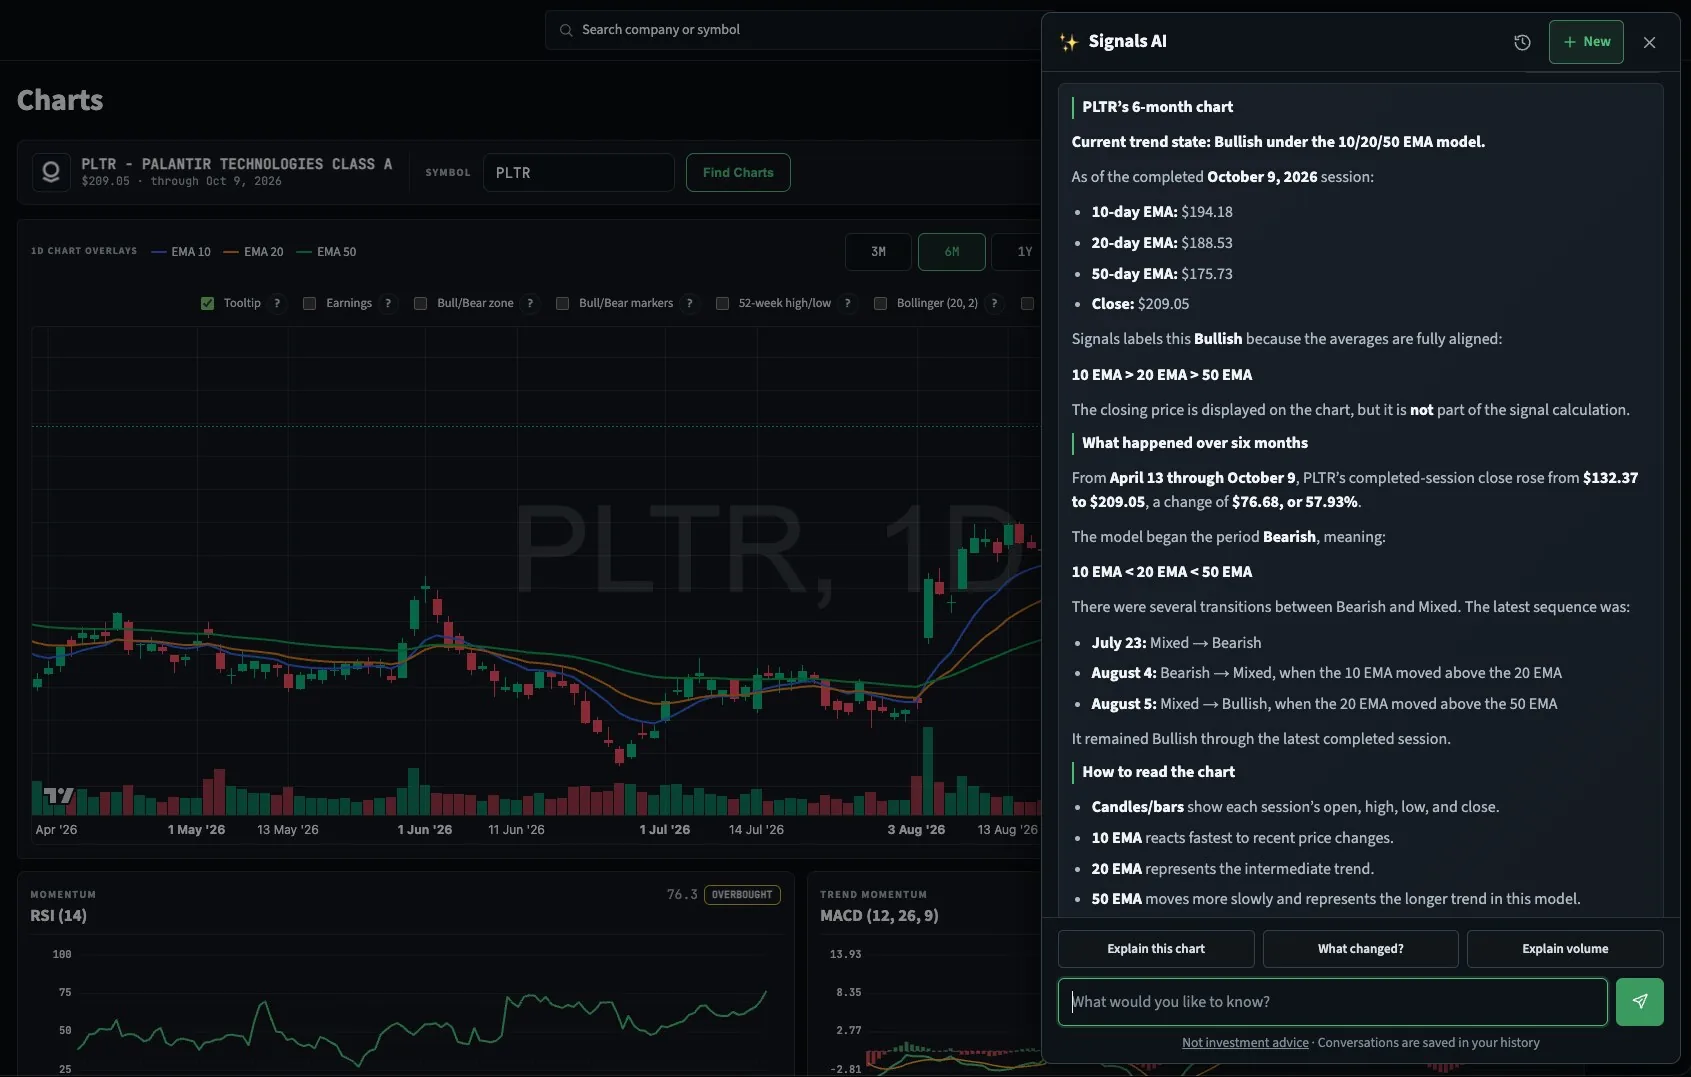
Candles, volume and your trend model's averages drawn together, with labels pinned to the price axis, plus RSI and MACD momentum panels underneath. Here MNST's averages have rolled over into a Bearish order.
- Your model's averages, labelled on the axis
- RSI and MACD momentum panels
- Range-anchored VWAP, Bollinger, Donchian, Keltner and earnings
Your ideas, with their direction attached.
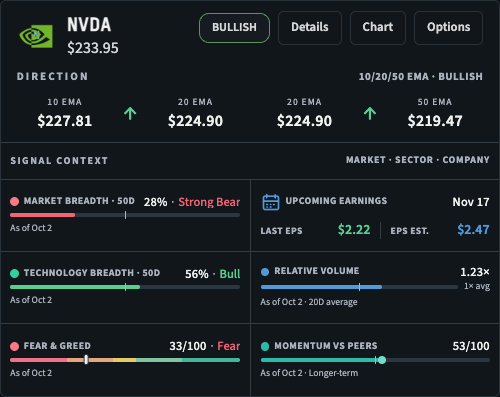
Each watchlist card shows the current trend and how each average compares with the next, so you can see at a glance which names need attention today.
- Multiple named lists
- Direction on every card
- Jump to chart, details or options
Let the market come to you.
Set alerts on a price, a percentage move, a 52-week range or a moving-average cross, add a note, and get an email when one triggers.
- Price, % move, range, MA and ATR conditions
- Create up to five in one go
- Pause, edit or delete any time
Where the money is leaning.
Most active symbols, the highest-volume contracts and unusual volume relative to open interest, all on one screen.
- Call/put split per symbol
- IV and open interest on each contract
- Search any optionable symbol
What Washington is trading.
Disclosed trades from the House and Senate, searchable by politician, ticker or chamber — with filing delays shown on every row.
- Most bought and most sold
- Top traders by party
- Owner, size and filing lag
More about Congress Trades →
What people are talking about.
A ranking of the most-discussed stocks online by mentions, upvotes and how each compares with the prior 24 hours. Filter to the names that are rising or falling.
- Most discussed and most upvoted
- Biggest rank gains
- Rising and falling filters