Signals/How trends work
How Signals reads a stock's trend.
Signals compares a stock's moving averages after each completed trading day and labels it Bullish, Mixed or Bearish. You choose the averages: one of four presets, or your own SMA or EMA periods.
14 days free, then $20 a month. Research tools, not investment advice.
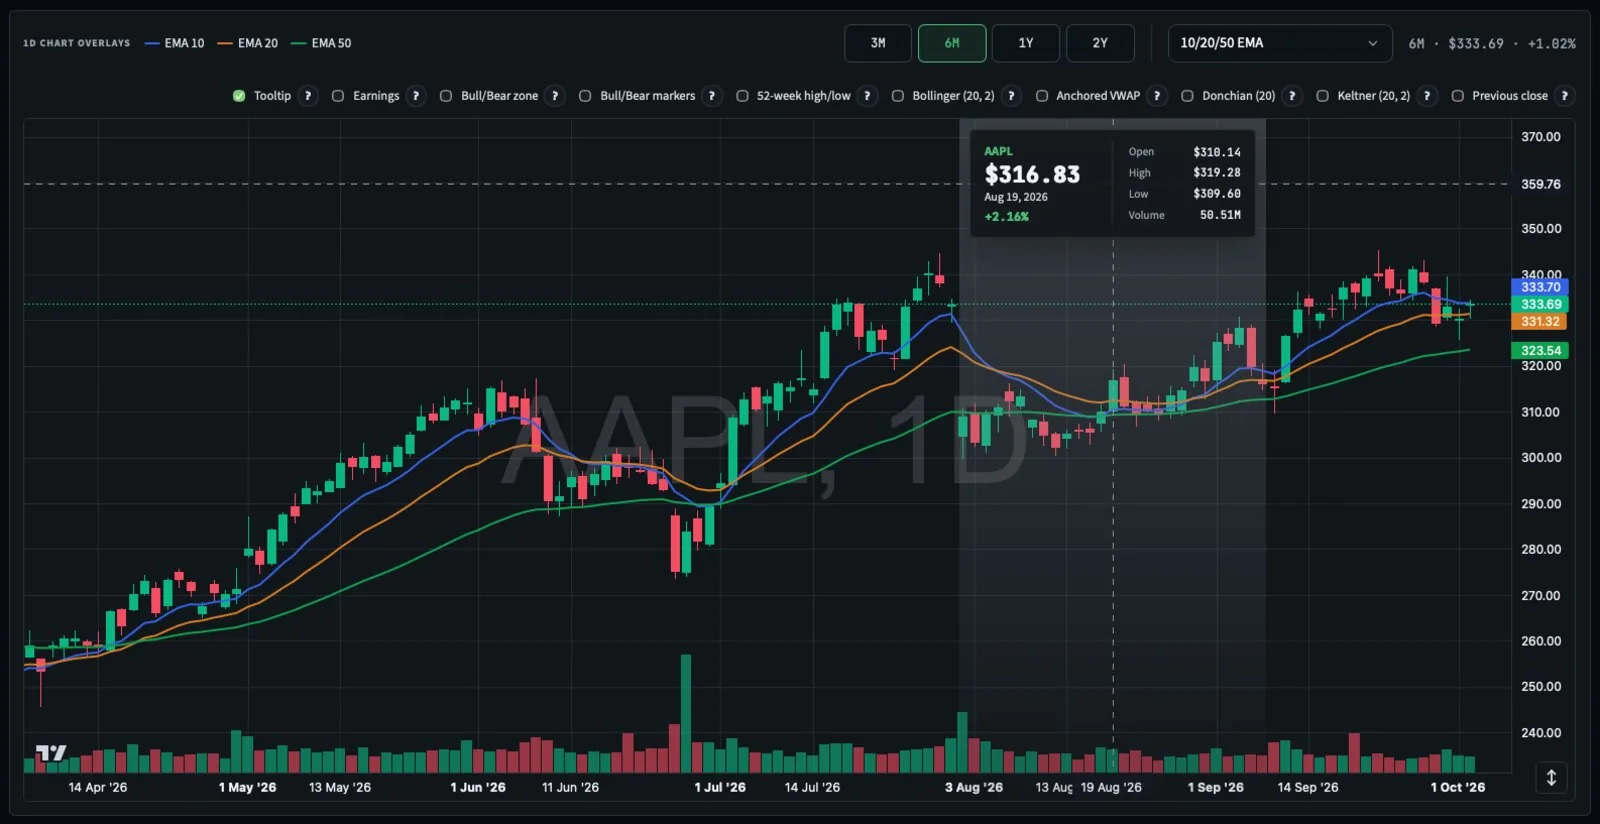
The averages, in order.
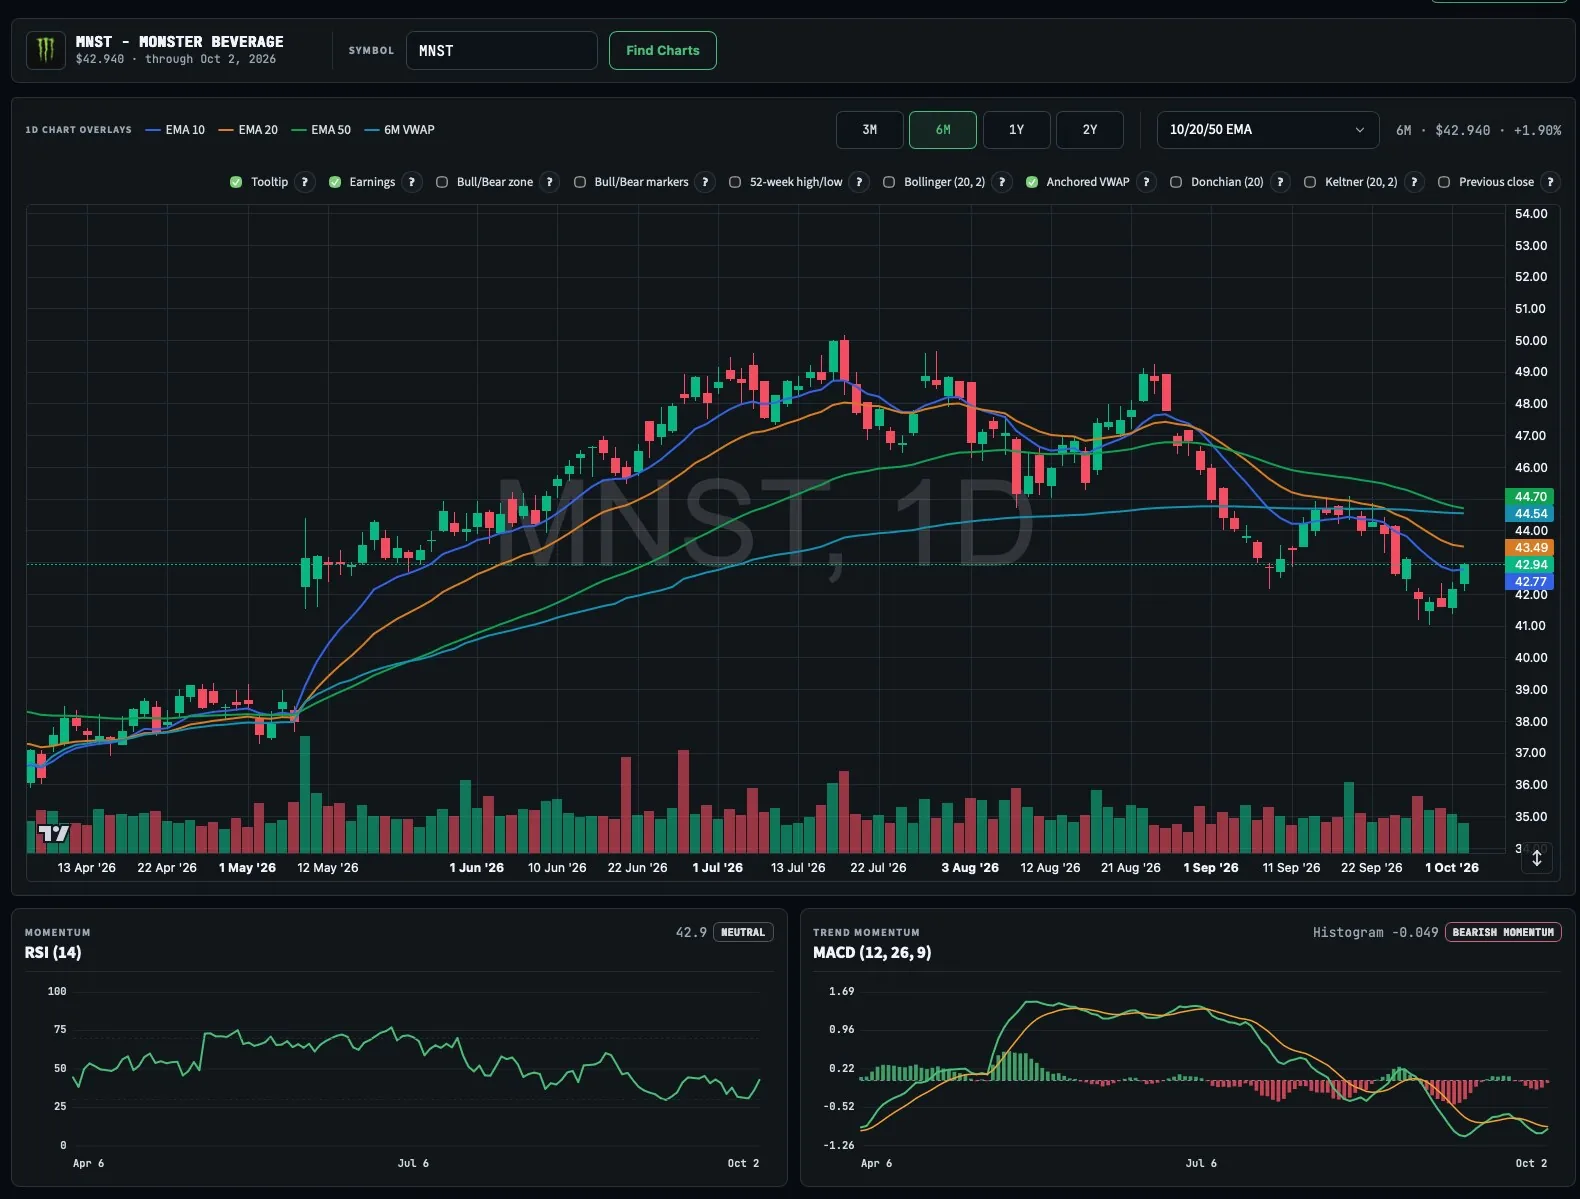
With three averages, a stock is Bullish when each faster average sits above the next slower one, and Bearish when each sits below. Anything in between is Mixed: the trend is turning or undecided.
| Label | Three averages (e.g. 10/20/50 EMA) |
|---|---|
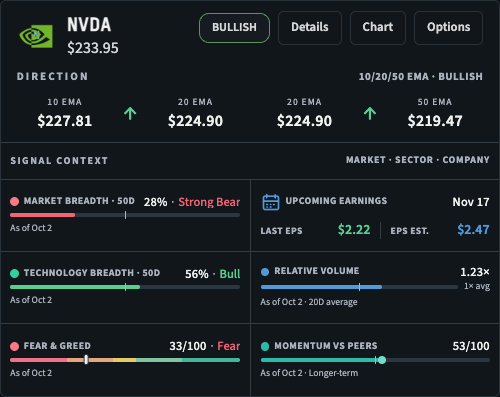
| BULLISH | 10 EMA above 20 EMA, and 20 EMA above 50 EMA. |
| MIXED | The averages are out of order. |
| BEARISH | 10 EMA below 20 EMA, and 20 EMA below 50 EMA. |
With two averages, such as 50/200 SMA, a stock is Bullish when the faster average is above the slower one and Bearish when it's below. It's Mixed only when they're exactly equal or there isn't enough history yet.
Choose the model that fits how you invest.
| Model | Averages | Good for |
|---|---|---|
| 10/20/50 EMA | EMA 10 · 20 · 50 | Shorter swings. Exponential averages react faster to recent prices. |
| 10/20/50 SMA | SMA 10 · 20 · 50 | The same horizon, with simple averages that move more steadily. |
| 20/50/200 SMA | SMA 20 · 50 · 200 | Intermediate to long-term trends. |
| 50/200 SMA | SMA 50 · 200 | The long-term picture, with two averages. |
| Custom | SMA or EMA, 2–3 periods | Your own periods, from 2 to 250 days. |
Two stocks, two directions.
4,842 stocks, one label each.
At the Oct 2, 2026 close on 10/20/50 EMA, Stock Trends sorted every covered stock into three columns.
1,006
Averages stacked fastest on top.
971
Averages out of order.
2,865
Averages stacked slowest on top.
Trend FAQ
Which prices does Signals use?
Completed daily bars, split-adjusted. A stock's label changes only after a trading day closes, never mid-session.
How is the EMA calculated?
Each exponential moving average starts from the simple average of its first period, then weights each new close by 2 ÷ (period + 1).
What's the difference between SMA and EMA?
A simple moving average weights every day equally. An exponential one gives recent days more weight, so it turns sooner.
Does Bullish mean I should buy?
No. A trend label describes past price behavior and doesn't predict future results.
See where your stocks stand.
Pick your model and see every covered stock labelled. Free for 14 days.